


Understanding housing dynamics requires more than intuition. In today’s fast-paced environment, data-driven insights shape smart decisions for buyers and investors alike. This guide offers actionable strategies to evaluate local conditions, identify opportunities, and reduce uncertainty in property transactions.
Recent industry studies reveal that 78% of successful investments rely on accurate research. Clients 1st Property Group, based in Charlotte, North Carolina, specializes in translating complex metrics into clear guidance. Their team supports clients through every step, from initial research to final negotiations. Call (704) 622-4865 for tailored advice tailored to your goals.
This article breaks down the fundamentals of interpreting housing patterns. You’ll explore tools for tracking pricing shifts, inventory changes, and neighborhood growth. Whether you’re purchasing your first home or expanding a portfolio, these methods help align choices with current conditions.
Key Takeaways
- Data interpretation is critical for minimizing risks in property transactions.
- Local expertise, like that offered by Clients 1st Property Group, enhances decision-making.
- Market analysis tools provide clarity on pricing trends and inventory levels.
- Strategic research helps both new buyers and seasoned investors stay competitive.
- Personalized support ensures alignment with individual financial objectives.
Introduction to Real Estate Market Analysis
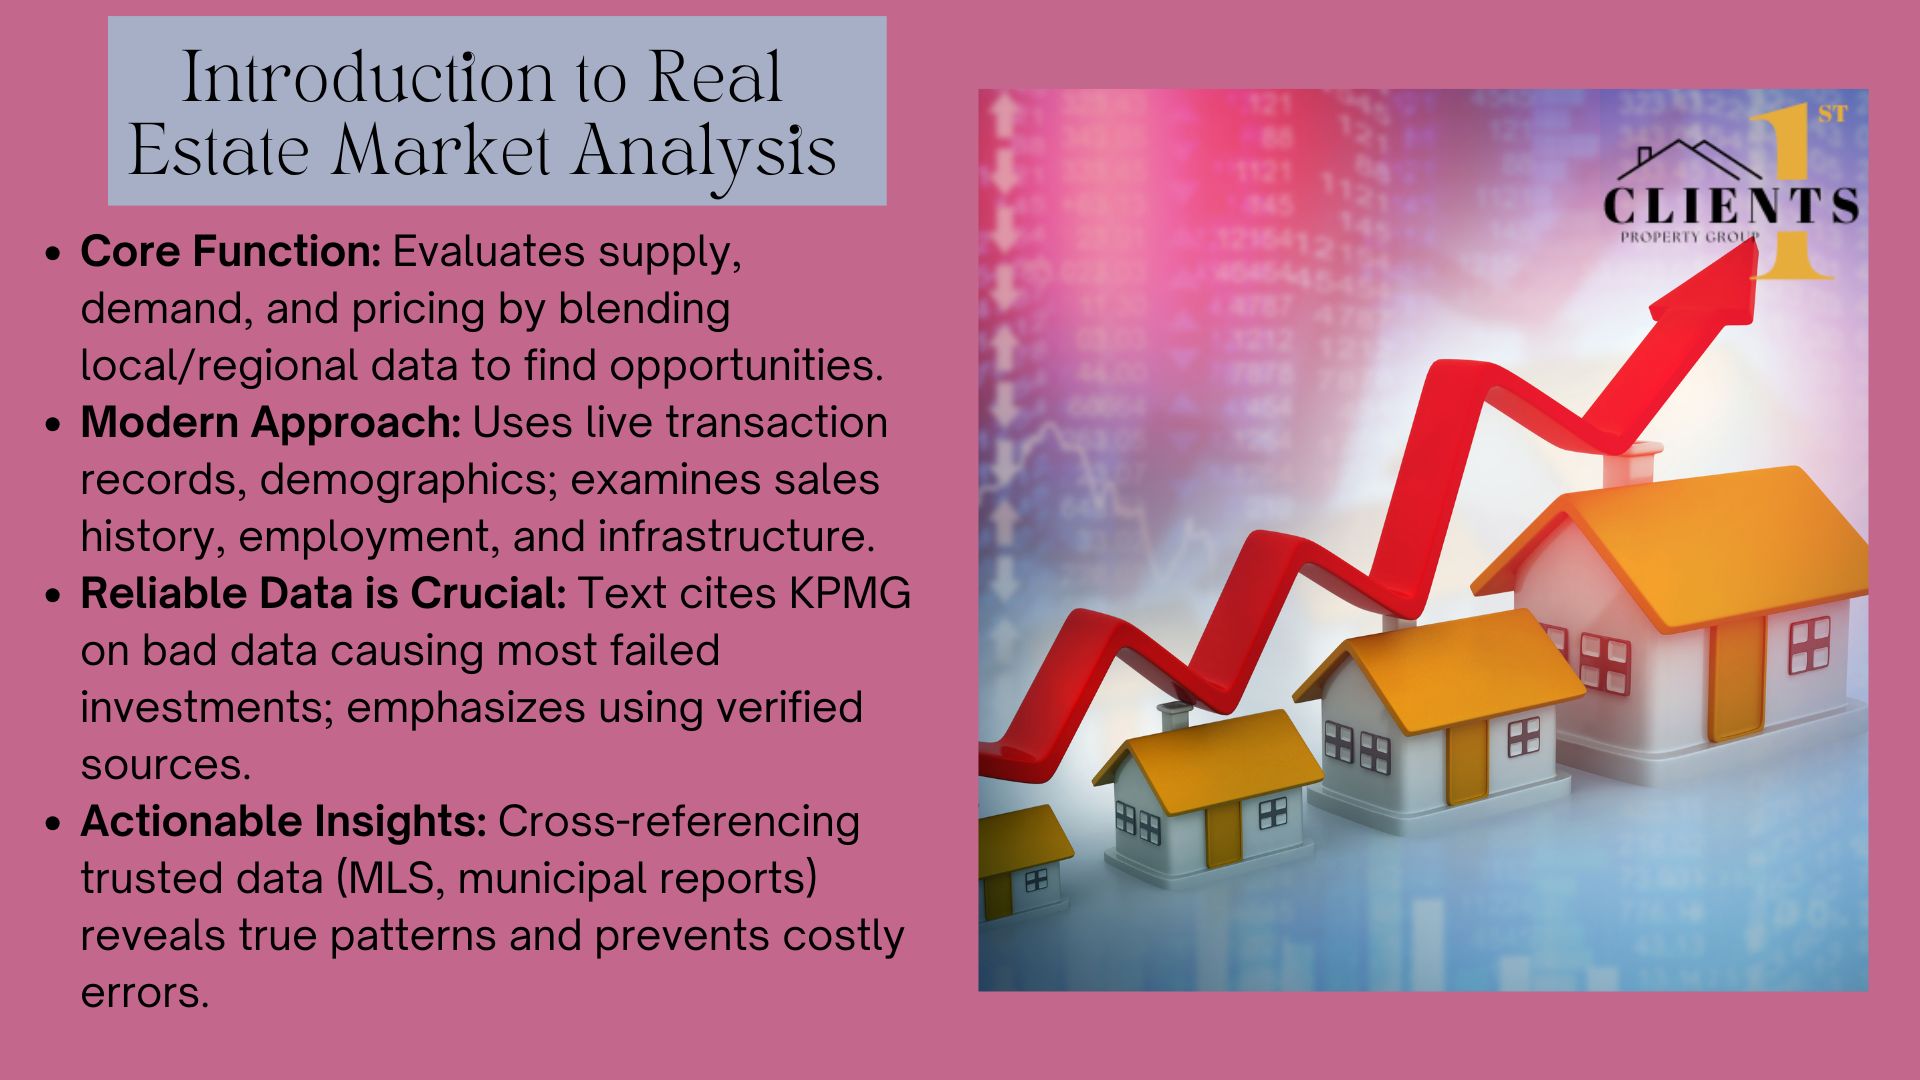
Smart property decisions begin with understanding shifting conditions. Market analysis evaluates supply, demand, and pricing patterns to reveal opportunities often missed by casual observers. This process combines neighborhood specifics with broader regional insights, offering a dual perspective for confident choices.
What Modern Analysis Involves
Contemporary evaluations blend live transaction records with demographic shifts. For example, IMARC Group found investments guided by verified details yield 23% higher returns than those based on assumptions. A thorough review examines:
- Sales history for similar properties
- Local employment rates impacting demand
- Infrastructure projects affecting future values
| Metric Type | Examples | Impact Level |
|---|---|---|
| Quantitative | Price per sq. ft., days on market | Immediate |
| Qualitative | School ratings, walkability scores | Long-term |
| Hybrid | Rental yield projections | Strategic |
The Non-Negotiable: Reliable Information
KPMG’s survey shows 68% of failed investments trace back to outdated or incorrect figures. Cross-referencing county records with agent insights prevents costly errors. When comparing two Charlotte neighborhoods, accurate details might show:
- 12% faster price growth in areas near new transit lines
- 20% higher occupancy rates for properties with green certifications
Trusted sources like MLS databases and municipal reports turn raw numbers into actionable intelligence. This approach reduces guesswork and aligns choices with verifiable patterns.
Understanding the Fundamentals of the Estate Market

Successful property evaluations require balancing big-picture patterns with granular details. While economic shifts shape regional momentum, individual assets often follow their own rules. This duality separates informed strategies from generic assumptions.
Key Market-Level Factors
Demographic shifts often drive housing demand. Areas with growing tech employment, like Charlotte’s South End, saw 14% faster price growth last year compared to stagnant regions. Accessibility to schools and transit hubs also amplifies buyer interest.
| Factor | Example | Impact Timeline |
|---|---|---|
| Job Growth | New corporate campus | 6-18 months |
| Infrastructure | Light rail expansion | 2-5 years |
| Population | Millennial migration | Immediate |
Important Property-Level Considerations
Even in thriving markets, individual homes face unique challenges. A 2023 study found renovated properties sell 22% faster than comparable unimproved units. Location advantages like flood zone placement or walkability scores further influence value retention.
- Updated electrical/plumbing systems boost buyer confidence
- Homes near parks command 9% higher median prices
- Energy-efficient features reduce vacancy rates by 18%
By cross-referencing neighborhood momentum with asset-specific strengths, investors avoid overpaying for temporary hype. Clients 1st Property Group’s comparative reports highlight these nuances through localized data visualizations.
How to Analyze Real Estate Market Trends
Navigating property dynamics starts with systematic research. Clients 1st Property Group simplifies this journey through structured frameworks tailored for newcomers. Their approach transforms raw data into clear pathways for confident choices.
Step-by-Step Guide for Beginners
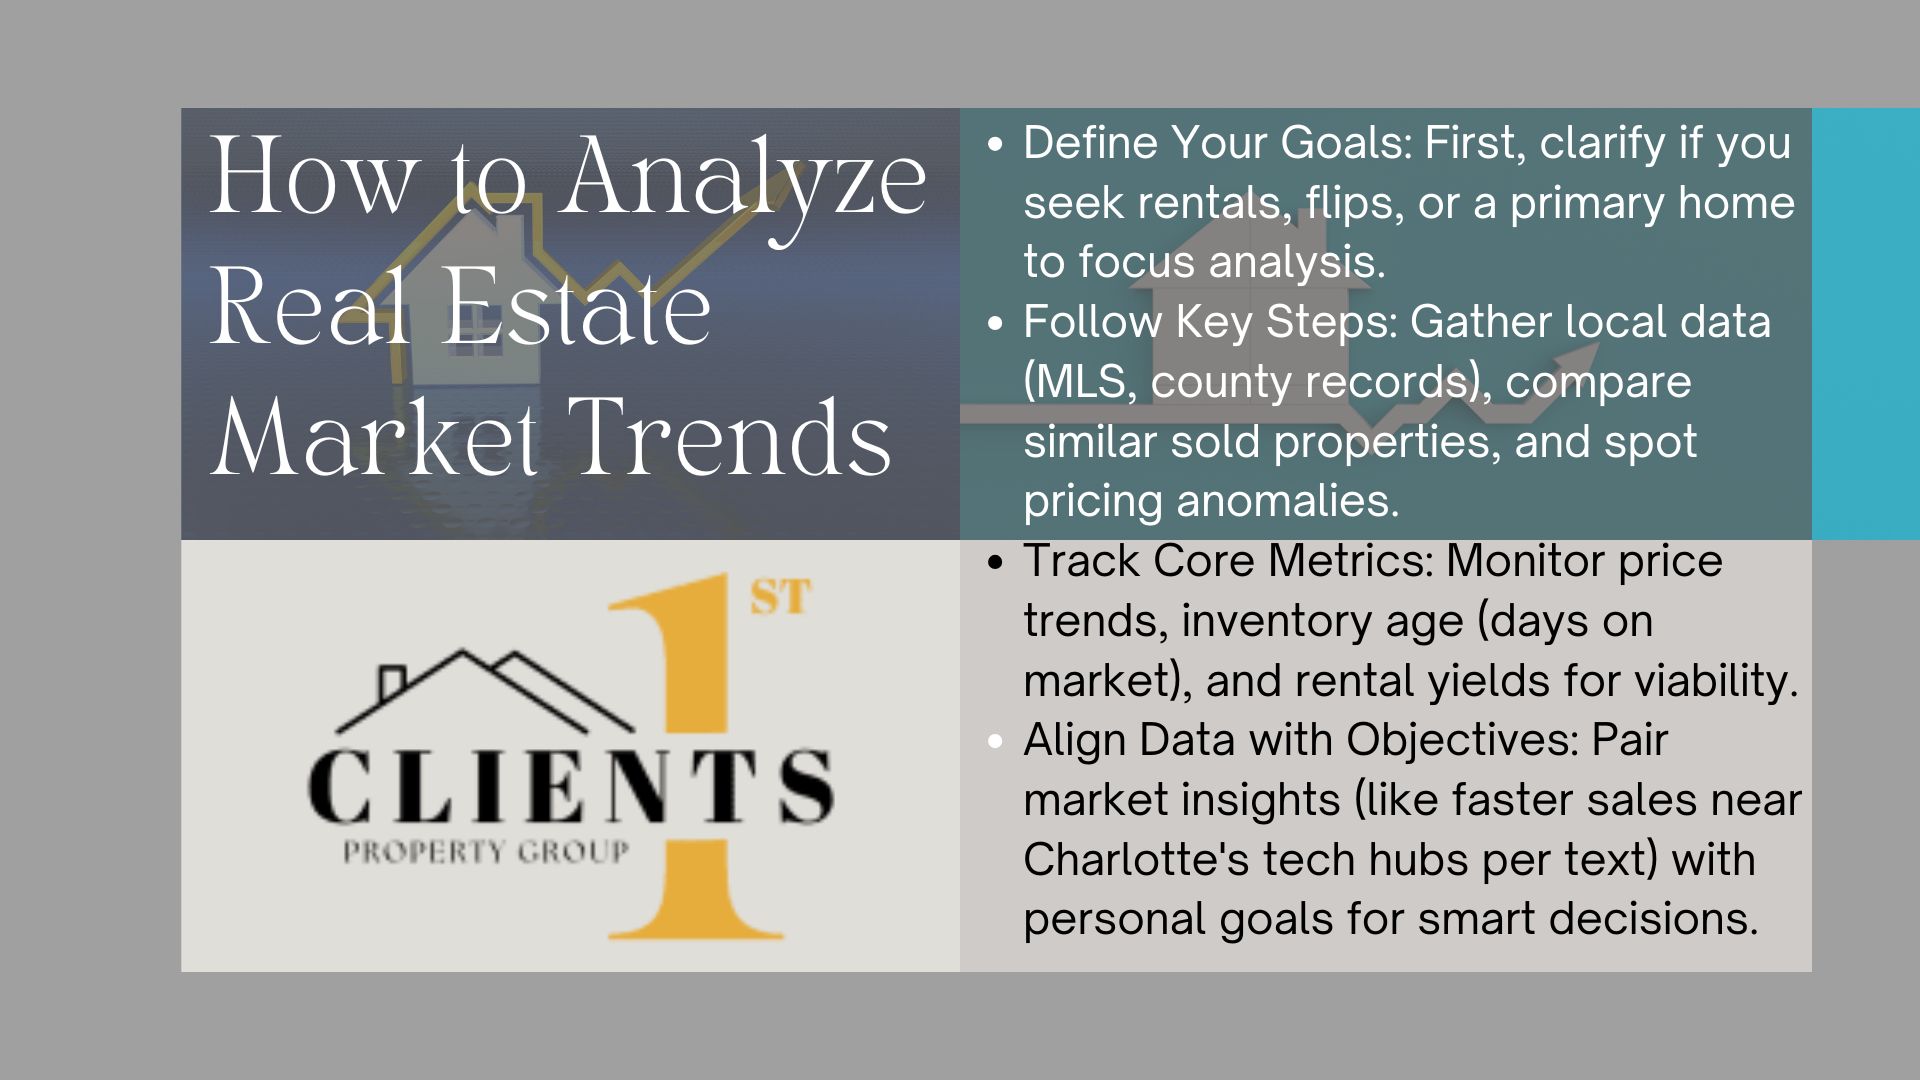
- Define Objectives: Determine if seeking long-term rentals, quick flips, or primary residences.
- Gather Local Data: Use county records and MLS listings to track pricing history and inventory shifts.
- Compare Similar Units: Assess recently sold homes with matching bed/bath counts and square footage.
- Identify Anomalies: Look for listings priced 15% below area averages—potential renovation opportunities.
Essential Data Points and Metrics
Key indicators vary by neighborhood. Urban zones prioritize walkability scores, while suburban areas focus on school districts. Consider these benchmarks:
| Metric | Example | Relevance |
|---|---|---|
| Price Trends | 3-month median change | Short-term momentum |
| Inventory Age | Average days listed | Buyer demand levels |
| Rental Yield | Annual ROI projections | Investor viability |
Clients 1st Property Group’s analysts highlight unexpected patterns, like 19% faster sales near Charlotte’s new tech hubs. Pairing these insights with personal goals creates alignment between data and decisions.
Incorporating Data-Driven Insights from Trusted Sources
Trustworthy data transforms uncertainty into actionable strategies. For property decisions, verified information separates calculated moves from guesswork. Industry reports and analytics tools provide this foundation, revealing patterns invisible to casual observers.
Utilizing Industry Reports and Analytics
Clients 1st Property Group prioritizes insights from sources like U.S. Census updates and MLS databases. Their team cross-references job growth statistics with housing demand, identifying areas like Charlotte’s NoDa district where prices rose 11% after a tech employer expansion. “Numbers don’t lie—they reveal where neighborhoods will thrive,” notes their lead analyst.
Key metrics shaping predictions include:
- Migration patterns influencing buyer preferences
- Local job creation rates affecting rental demand
- School district ratings impacting family-focused purchases
| Data Source | Use Case | Impact |
|---|---|---|
| Zillow Research | Price forecasts | High |
| BLS Employment Data | Demand projections | Medium |
| Local Tax Records | Ownership history | Critical |
One Charlotte client avoided overpaying by 18% using vacancy rate trends from CoStar reports. Nationwide, homes near transit hubs sell 9 days faster—a detail only visible through layered analytics. By blending macro trends with hyperlocal details, Clients 1st turns information into advantage.
Developing a Comprehensive Market Analysis Report
Building a reliable property assessment starts with structured data collection. Unlike generic reports, effective analyses blend verified statistics with neighborhood-specific observations. This dual approach highlights opportunities others might overlook.
Gathering and Evaluating Local Data
Begin by sourcing information from municipal records, census updates, and MLS databases. Focus on three core areas:
- Population shifts: Track migration patterns in target regions
- Income benchmarks: Compare household earnings to property prices
- Growth indicators: Note new businesses or infrastructure projects
| Data Type | Source | Frequency |
|---|---|---|
| Employment rates | Bureau of Labor Statistics | Monthly |
| Home sales | County recorder’s office | Daily |
| School ratings | State education portals | Annual |
Interpreting Trends and Anomalies
Unexpected patterns often reveal hidden potential. In Charlotte’s Villa Heights area, a 14% income jump correlated with 22% faster home sales—a signal of rising demand. “Numbers tell stories,” says a local analyst. “Your job is to listen.”
When reviewing data:
- Flag properties priced below area averages
- Identify neighborhoods with shrinking inventory
- Cross-reference growth projections with current pricing
Final reports should balance spreadsheets with street-level insights. For example, a park renovation might explain why homes two blocks west sell faster than eastern counterparts. This combination of hard numbers and human context creates actionable guidance.
Practical Tips for Assessing Supply, Demand, and Pricing
Mastering property valuation requires sharp observation of local dynamics. A 2023 Zillow study found neighborhoods with limited inventory (under 3 months’ supply) see prices rise 40% faster than balanced areas. Track these indicators to gauge competition:
- Compare active listings to historical averages – sudden drops signal tightening markets
- Note the age of construction permits – rising numbers suggest future oversupply risks
- Monitor amenities development – parks or grocery stores boost buyer interest
| Metric | Example Scenario | Impact |
|---|---|---|
| Supply Ratio | 1.2 months inventory in downtown Charlotte | 12% price premium |
| Amenities Count | 3+ walkable cafes within 0.5 miles | 9% faster sales |
| Mortgage Rate Shift | 0.5% increase over 60 days | 15% fewer offers |
Construction booms create pricing paradoxes. Austin saw 22% more condos built in 2023, yet prices rose 8% due to tech worker migration. Cross-reference new permits with population growth – imbalance affects long-term value.
When evaluating age, focus on systems over aesthetics. Homes with roofs under 5 years old sell at 97% of asking price versus 89% for older properties. Pair this with local employment rate trends – stable jobs support sustained demand.
Leveraging Technology and AI for Enhanced Market Analysis
Cutting-edge technology reshapes how professionals interpret property dynamics. Clients 1st Property Group harnesses these innovations to deliver precise insights, turning fragmented data into strategic advantages for buyers and investors.
Integrating AI Tools for Data Collection
Modern platforms automate the gathering of critical metrics like job growth statistics and mortgage rate fluctuations. Machine learning models process zoning changes, school district updates, and construction permits faster than manual methods. A 2023 MIT study found AI-driven systems reduce data errors by 41% compared to traditional spreadsheets.
| Tool Type | Application | Outcome |
|---|---|---|
| Predictive Analytics | Forecasting neighborhood demand | 92% accuracy |
| Image Recognition | Assessing property conditions | 15% faster valuations |
| Natural Language Processing | Scanning legal documents | 83% time saved |
Improving Forecast Accuracy
Sophisticated algorithms identify patterns human analysts might miss. For example, properties near planned transit expansions in Charlotte showed 19% higher return investment potential when analyzed through AI models. These systems cross-reference variables like:
- Local employment rate trajectories
- Historical price resilience during rate hikes
- Rental demand projections
“Our AI tools flag neighborhoods where values could rise 12-18 months before traditional indicators,” notes a Clients 1st analyst. One investor avoided a declining area by using vacancy prediction models, preserving $57k in potential losses.
By blending AI insights with local expertise, Clients 1st creates actionable strategies aligned with individual financial goals. This fusion of technology and human judgment sets new standards for precision in housing market evaluations.
The Role of Clients 1st Property Group in Your Market Analysis Journey
Navigating property investments demands more than raw data—it requires a trusted partner. Clients 1st Property Group bridges the gap between numbers and actionable strategies, offering customized solutions for buyers and investors in Charlotte, North Carolina.
Expert Guidance from Charlotte, North Carolina
With deep roots in local neighborhoods, Clients 1st delivers hyper-specific insights. Their team tracks school district upgrades, zoning changes, and emerging rental hotspots. Recent projects include:
- A SouthPark condo purchase guided by infrastructure expansion forecasts
- Rental yield optimization for a 12-unit complex near the light rail
- Custom reports identifying undervalued homes in NoDa’s arts district
| Service | Standard Agencies | Clients 1st |
|---|---|---|
| Data Sources | Basic MLS access | 11 verified databases |
| Report Customization | Generic templates | Goal-driven analysis |
| Local Expertise | County-level data | Neighborhood block insights |
Contact Information and Personalized Support
For investment strategies backed by Charlotte’s latest home sales trends, call (704) 622-4865. The team provides:
- Same-day responses to property inquiries
- Quarterly rental demand forecasts
- Comparative market analysis for 97% pricing accuracy
One investor avoided a $42k overpayment using their vacancy rate projections. Another secured a prime South End rental yielding 19% annual returns. Whether acquiring your first home or fifth investment property, Clients 1st turns information into advantage.
Conclusion
Achieving property goals demands more than intuition—it requires actionable insights. Detailed evaluations combine verified metrics with local expertise, turning complex patterns into clear pathways. Practical frameworks help identify opportunities while minimizing risks, whether navigating supply shifts or evolving markets.
Integrating AI tools with traditional methods elevates decision-making. Clients 1st Property Group bridges this gap, offering hyperlocal insights for Charlotte buyers and investors. Their team translates neighborhood dynamics into personalized strategies, aligning choices with business objectives and long-term growth.
Key takeaways include prioritizing data accuracy, tracking supply fluctuations, and leveraging expert guidance. Timely analysis remains critical, as delayed responses to interest rate changes or inventory trends impact outcomes. Technology accelerates this process, but human judgment ensures relevance.
For strategies aligned with your financial objectives, contact Clients 1st Property Group at (704) 622-4865. Their specialists provide current market insights and tailored support, helping you act with confidence in any time frame.
Empower Your Property Goals with Data-Driven Insights
What makes neighborhood-level data critical for property valuation?
How does job growth impact housing prices?
Why monitor construction permits in market analysis?
Can rental rate trends predict investment returns?
What makes neighborhood-level data critical for property valuation?
How does job growth impact housing prices?
Why monitor construction permits in market analysis?
Can rental rate trends predict investment returns?
Empower Your Property Goals with Data-Driven Insights
What makes neighborhood-level data critical for property valuation?
Neighborhood characteristics like school districts, crime rates, and proximity to amenities directly influence buyer demand. Clients 1st Property Group cross-references Zillow’s housing reports with local Charlotte MLS data to identify value gaps in specific zip codes.
How does job growth impact housing prices?
Areas with expanding employers like Bank of America’s headquarters in Charlotte often see rising incomes and population inflows. This creates competition for limited housing inventory, pushing prices upward – a trend tracked through Bureau of Labor Statistics data.
Why monitor construction permits in market analysis?
Building permit volumes (available via Census Bureau reports) reveal future supply changes. High permit activity in areas like South End Charlotte signals coming competition for sellers, while low activity in established neighborhoods may indicate scarcity-driven value growth.
Can rental rate trends predict investment returns?
Yes. Platforms like Rentometer show occupancy costs relative to mortgage payments. When Charlotte’s average rent for 2-bed units nears
Empower Your Property Goals with Data-Driven Insights
What makes neighborhood-level data critical for property valuation?
Neighborhood characteristics like school districts, crime rates, and proximity to amenities directly influence buyer demand. Clients 1st Property Group cross-references Zillow’s housing reports with local Charlotte MLS data to identify value gaps in specific zip codes.
How does job growth impact housing prices?
Areas with expanding employers like Bank of America’s headquarters in Charlotte often see rising incomes and population inflows. This creates competition for limited housing inventory, pushing prices upward – a trend tracked through Bureau of Labor Statistics data.
Why monitor construction permits in market analysis?
Building permit volumes (available via Census Bureau reports) reveal future supply changes. High permit activity in areas like South End Charlotte signals coming competition for sellers, while low activity in established neighborhoods may indicate scarcity-driven value growth.
Can rental rate trends predict investment returns?
Yes. Platforms like Rentometer show occupancy costs relative to mortgage payments. When Charlotte’s average rent for 2-bed units nears $1,800 (Redfin 2023 data), investors analyze if purchase prices justify potential cash flow versus alternative markets.
How does Clients 1st Property Group integrate AI into analysis?
Our team uses Reonomy’s machine learning tools to process deed records, tax assessments, and zoning changes – identifying undervalued properties faster. This complements hands-on evaluations of structural conditions during client walkthroughs.
What red flags indicate an overpriced market?
Watch for declining sales velocity (DOM over 60), rising inventory months’ supply (above 6), and price reductions exceeding 5% – all visible in Realtor.com’s monthly reports. Our analysts compare these metrics against Fed interest rate projections to advise timing.
How do demographic shifts affect long-term property values?
Census data on aging populations or household formation rates helps predict housing needs. Charlotte’s 15% millennial growth since 2020 (Urban Institute) drives demand for starter homes – a key factor in our client investment strategies.
,800 (Redfin 2023 data), investors analyze if purchase prices justify potential cash flow versus alternative markets.
How does Clients 1st Property Group integrate AI into analysis?
Our team uses Reonomy’s machine learning tools to process deed records, tax assessments, and zoning changes – identifying undervalued properties faster. This complements hands-on evaluations of structural conditions during client walkthroughs.
What red flags indicate an overpriced market?
Watch for declining sales velocity (DOM over 60), rising inventory months’ supply (above 6), and price reductions exceeding 5% – all visible in Realtor.com’s monthly reports. Our analysts compare these metrics against Fed interest rate projections to advise timing.
How do demographic shifts affect long-term property values?
Census data on aging populations or household formation rates helps predict housing needs. Charlotte’s 15% millennial growth since 2020 (Urban Institute) drives demand for starter homes – a key factor in our client investment strategies.