

Evaluating a property’s potential starts with mastering key metrics. One essential tool for investors is rental yield, which measures annual income against a property’s value. This figure helps determine whether an asset aligns with financial goals or requires adjustments.
For example, a $300,000 home generating $18,000 yearly in rent has a 6% yield. This percentage offers a snapshot of performance, but deeper analysis often reveals opportunities. Distinguishing between gross and net yields ensures accurate comparisons, as expenses like maintenance or taxes impact final returns.
Clients 1st Property Group, based in Charlotte, North Carolina, emphasizes data-driven strategies for local investors. Their team at (704) 622-4865 specializes in translating complex metrics into actionable plans. Whether you’re exploring your first purchase or expanding a portfolio, clarity on these calculations builds confidence.
This guide breaks down formulas, real-world scenarios, and improvement tactics. You’ll learn to identify undervalued properties, optimize pricing, and minimize hidden costs. By the end, you’ll have a framework to assess opportunities objectively and maximize long-term gains.
Key Takeaways
- Rental yield compares annual income to property value, highlighting investment potential.
- Gross yield focuses on revenue, while net yield accounts for expenses.
- Accurate calculations prevent overestimating returns.
- Charlotte’s Clients 1st Property Group offers localized expertise for investors.
- Actionable strategies can boost yields through pricing and cost management.
Understanding Rental Yield and Its Importance
Smart investors recognize that property performance hinges on measurable indicators. Rental yield stands out as a critical benchmark, offering clarity on income potential relative to asset value. Whether evaluating a single-family home or multi-unit complex, this metric shapes decisions by revealing efficiency and risk levels.
Defining Rental Yield
Gross rental yield reflects annual income divided by property price, ignoring expenses. For instance, a $250,000 asset generating $15,000 yearly rent delivers a 6% gross yield. Net rental yield, however, deducts costs like taxes, insurance, and repairs. This distinction matters:
- Gross metrics highlight revenue potential
- Net figures expose true profitability
- Both percentages guide pricing strategies
Industry data shows annual rental income accuracy directly impacts these calculations. Overestimating rent by 10% can inflate perceived returns by 15-20%.
Why Rental Yield Matters for Investors
A good rental yield varies by market, but targets often range between 5-10%. Charlotte’s Clients 1st Property Group notes:
“Yield analysis separates thriving portfolios from stagnant ones. It’s not just about income—it’s about sustainable growth.”
Understanding these metrics helps:
- Compare properties objectively
- Identify undervalued opportunities
- Anticipate cash flow challenges
Clients 1st emphasizes that rental yield property evaluations in their region require localized data. Vacancy rates, maintenance norms, and tax structures differ widely—factors net yield calculations address.
Mastering how to calculate rental yield
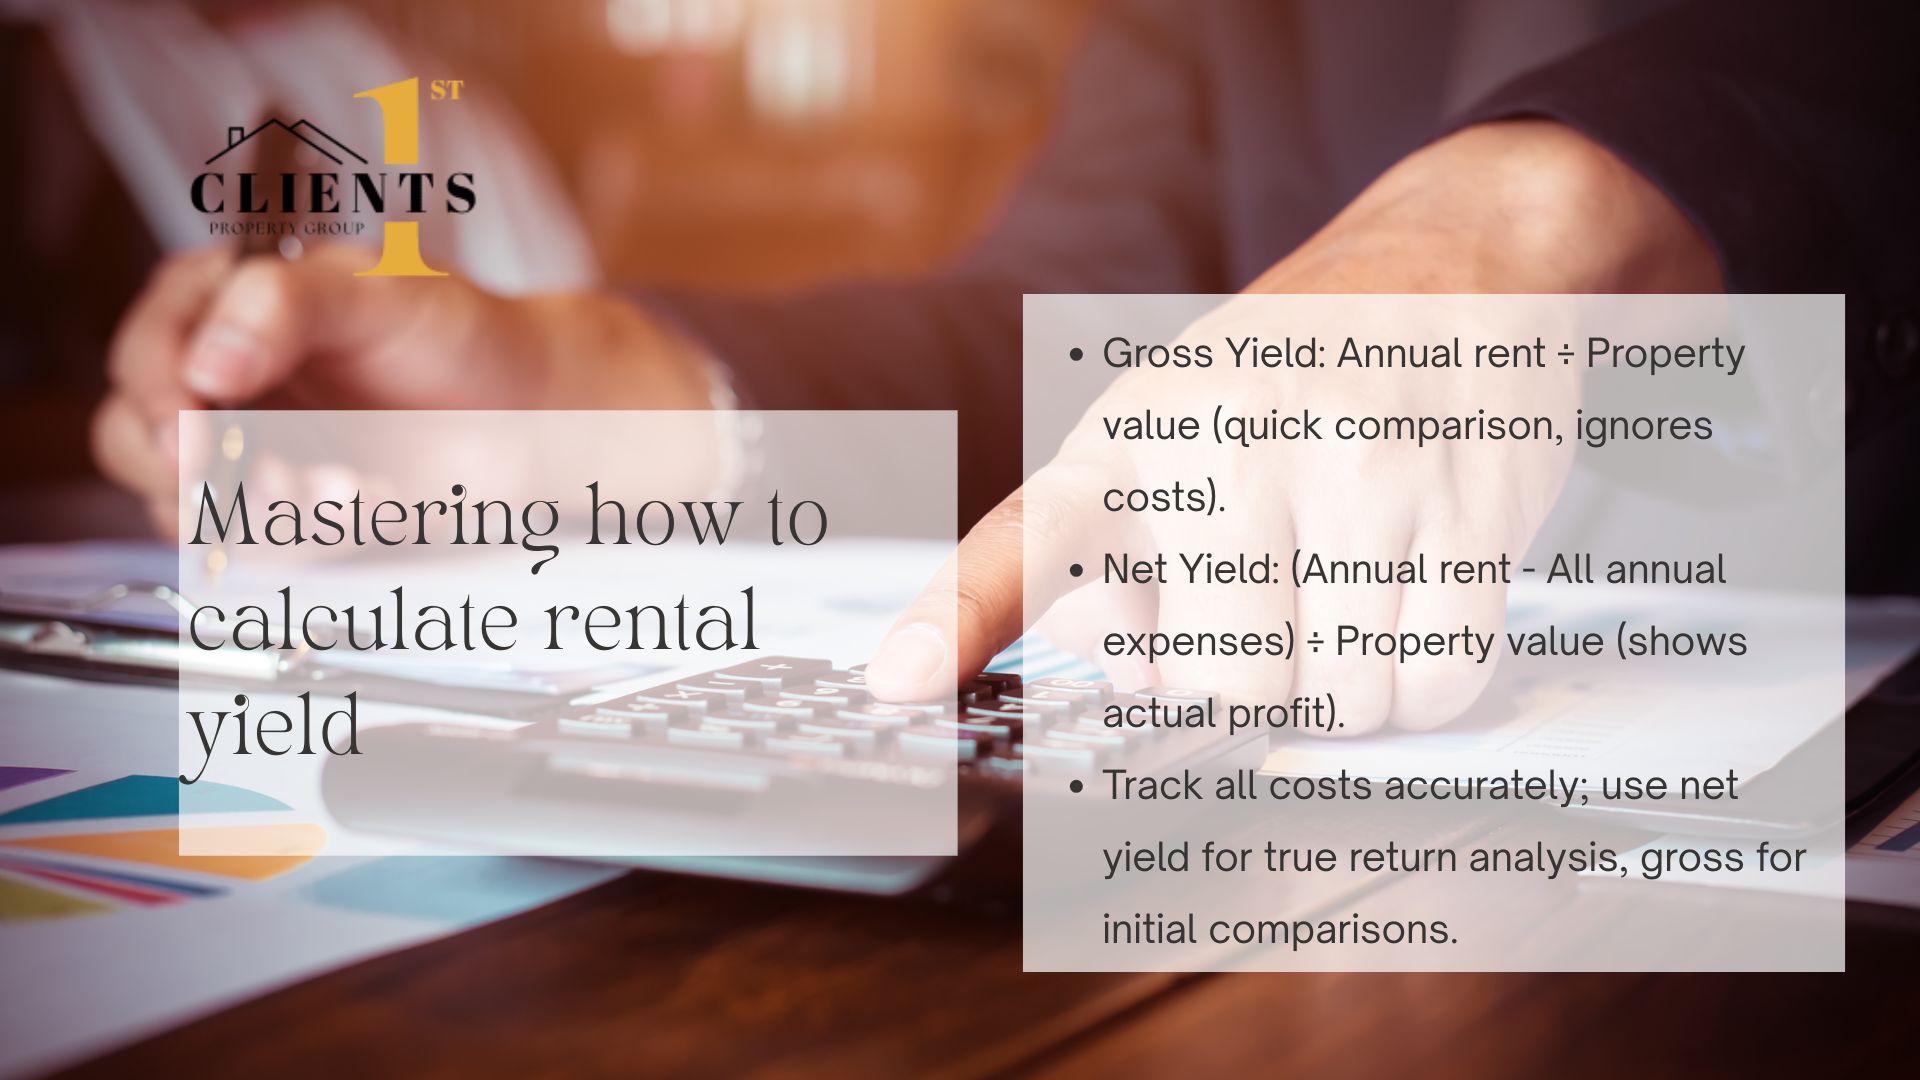
Property investors gain clarity on potential returns by systematically assessing income against property value. This process begins with accurate data collection and a clear grasp of two core metrics: gross and net figures.
First, compile twelve months of occupancy payments to establish baseline earnings. For properties with partial vacancies or seasonal fluctuations, use adjusted averages. Converting weekly or monthly amounts to annual totals requires multiplying by 52 or 12, respectively. A $2,000 monthly payment becomes $24,000 when annualized.
Consider a Charlotte duplex purchased for $400,000 generating $2,400 monthly. Annual rental income totals $28,800, resulting in a 7.2% gross rental yield. After subtracting $6,500 in yearly costs (taxes, insurance, repairs), the net rental yield drops to 5.6%.
Industry surveys reveal 43% of investors miscalculate returns by overlooking recurring fees. Common errors include underestimating maintenance budgets or forgetting property management expenses. Clients 1st Property Group analysts stress:
“Precision in tracking both revenue streams and operational costs separates profitable portfolios from underperformers.”
Consistent methodology matters. Whether evaluating a single-family home or multi-unit building, applying the same formulas ensures comparable results. Document every assumption—from vacancy rates to utility分摊—to maintain transparency in assessments.
Gross Rental Yield vs. Net Rental Yield
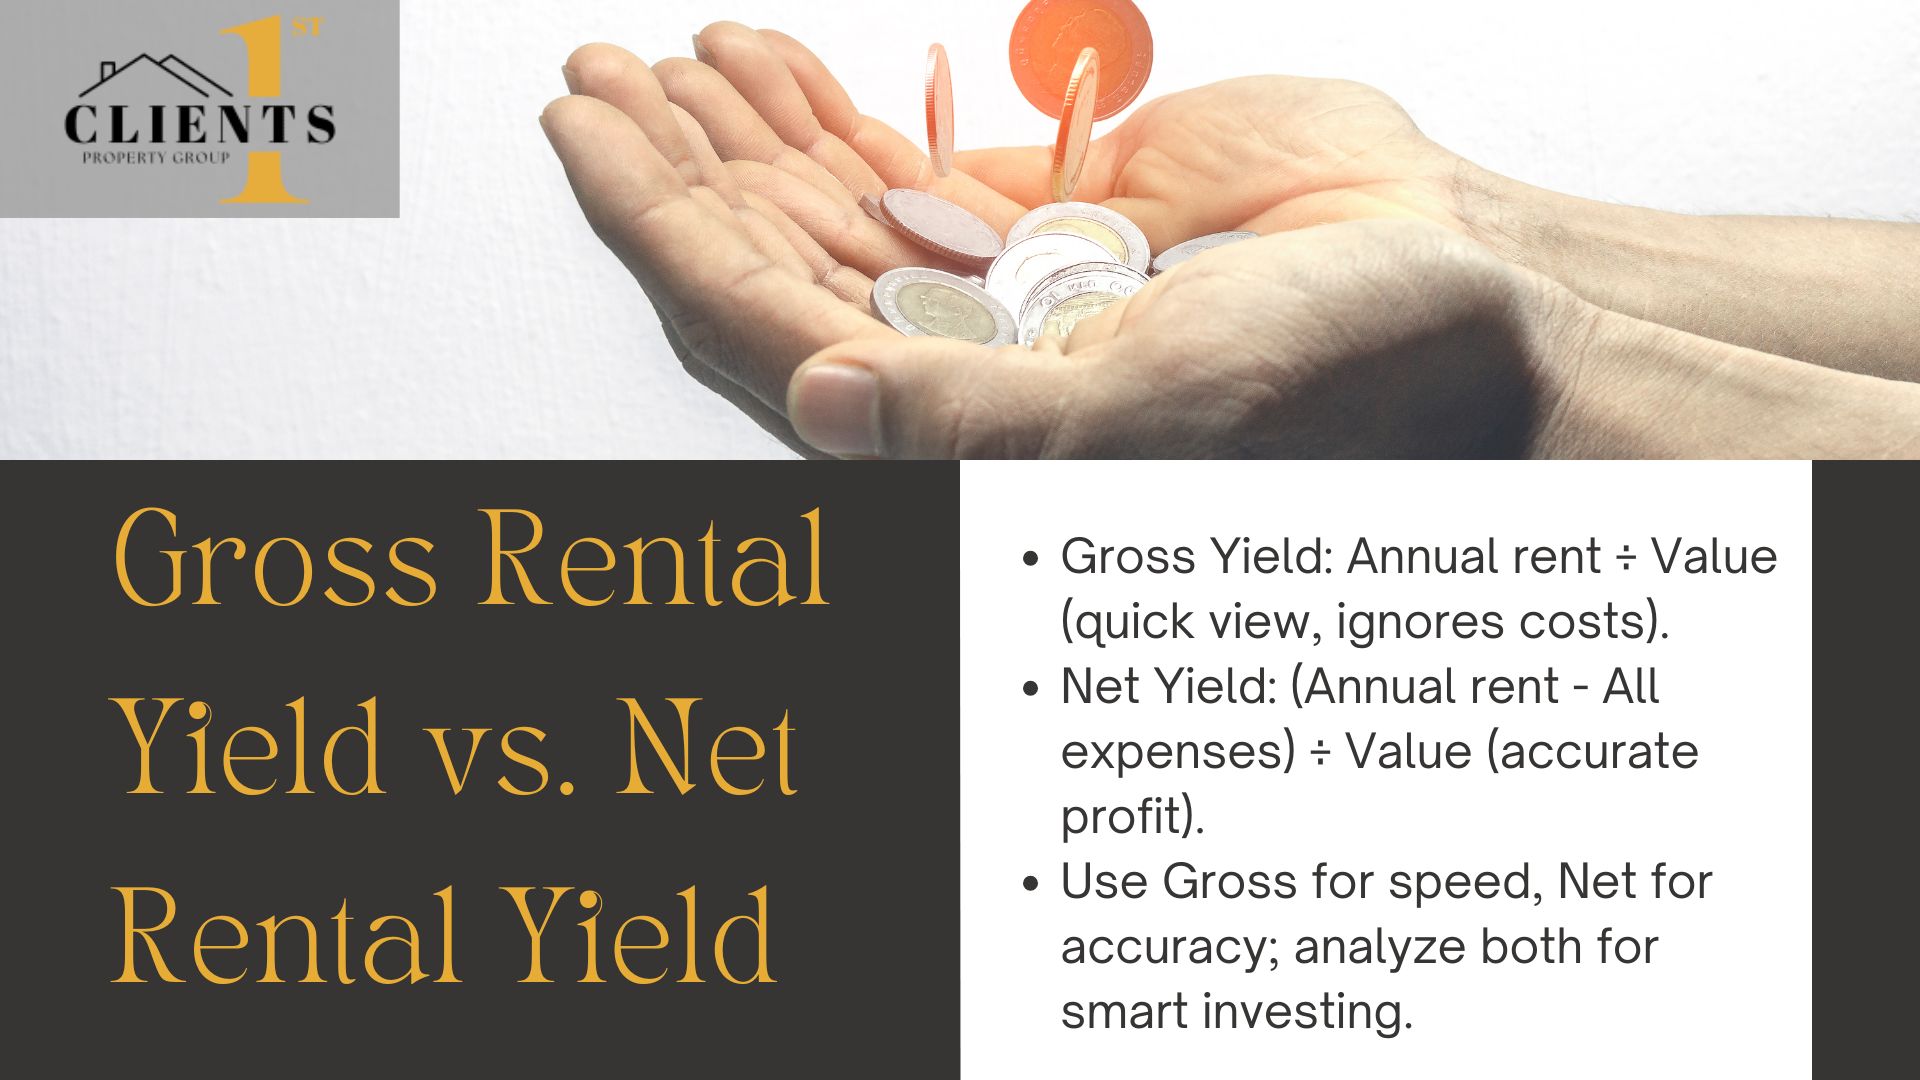
Property performance analysis demands understanding two distinct metrics: gross and net figures. While both assess income relative to value property, their calculations paint different financial pictures. Investors who grasp these differences avoid costly assumptions and prioritize good rental strategies.
Understanding Gross Rental Yield
Gross yield measures annual income against a property’s purchase price or market value. For example, a $350,000 asset generating $24,000 yearly achieves a 6.86% gross yield. This baseline metric helps quickly compare multiple listings. However, it ignores insurance, taxes, and upkeep—costs that erode actual profits.
Exploring Net Rental Yield
Net yield deducts all operating expenses from annual income. Using the same $350,000 property, subtract $7,000 in yearly costs. The adjusted $17,000 income creates a 4.86% net yield. National Association of Realtors data shows net figures typically run 1.5-3% lower than gross in competitive markets.
Consider these critical contrasts:
- Gross calculations favor speed; net favors accuracy
- Market shifts impact property purchase decisions differently for each metric
- Net yields better predict long-term return investment potential
“Focusing solely on gross numbers is like budgeting with Monopoly money—it looks real until bills arrive.”
Savvy investors analyze both metrics when evaluating yield property opportunities. A high gross yield might signal undervalued assets, while strong net figures often reflect efficient management. Balancing these insights builds portfolios resilient to market fluctuations.
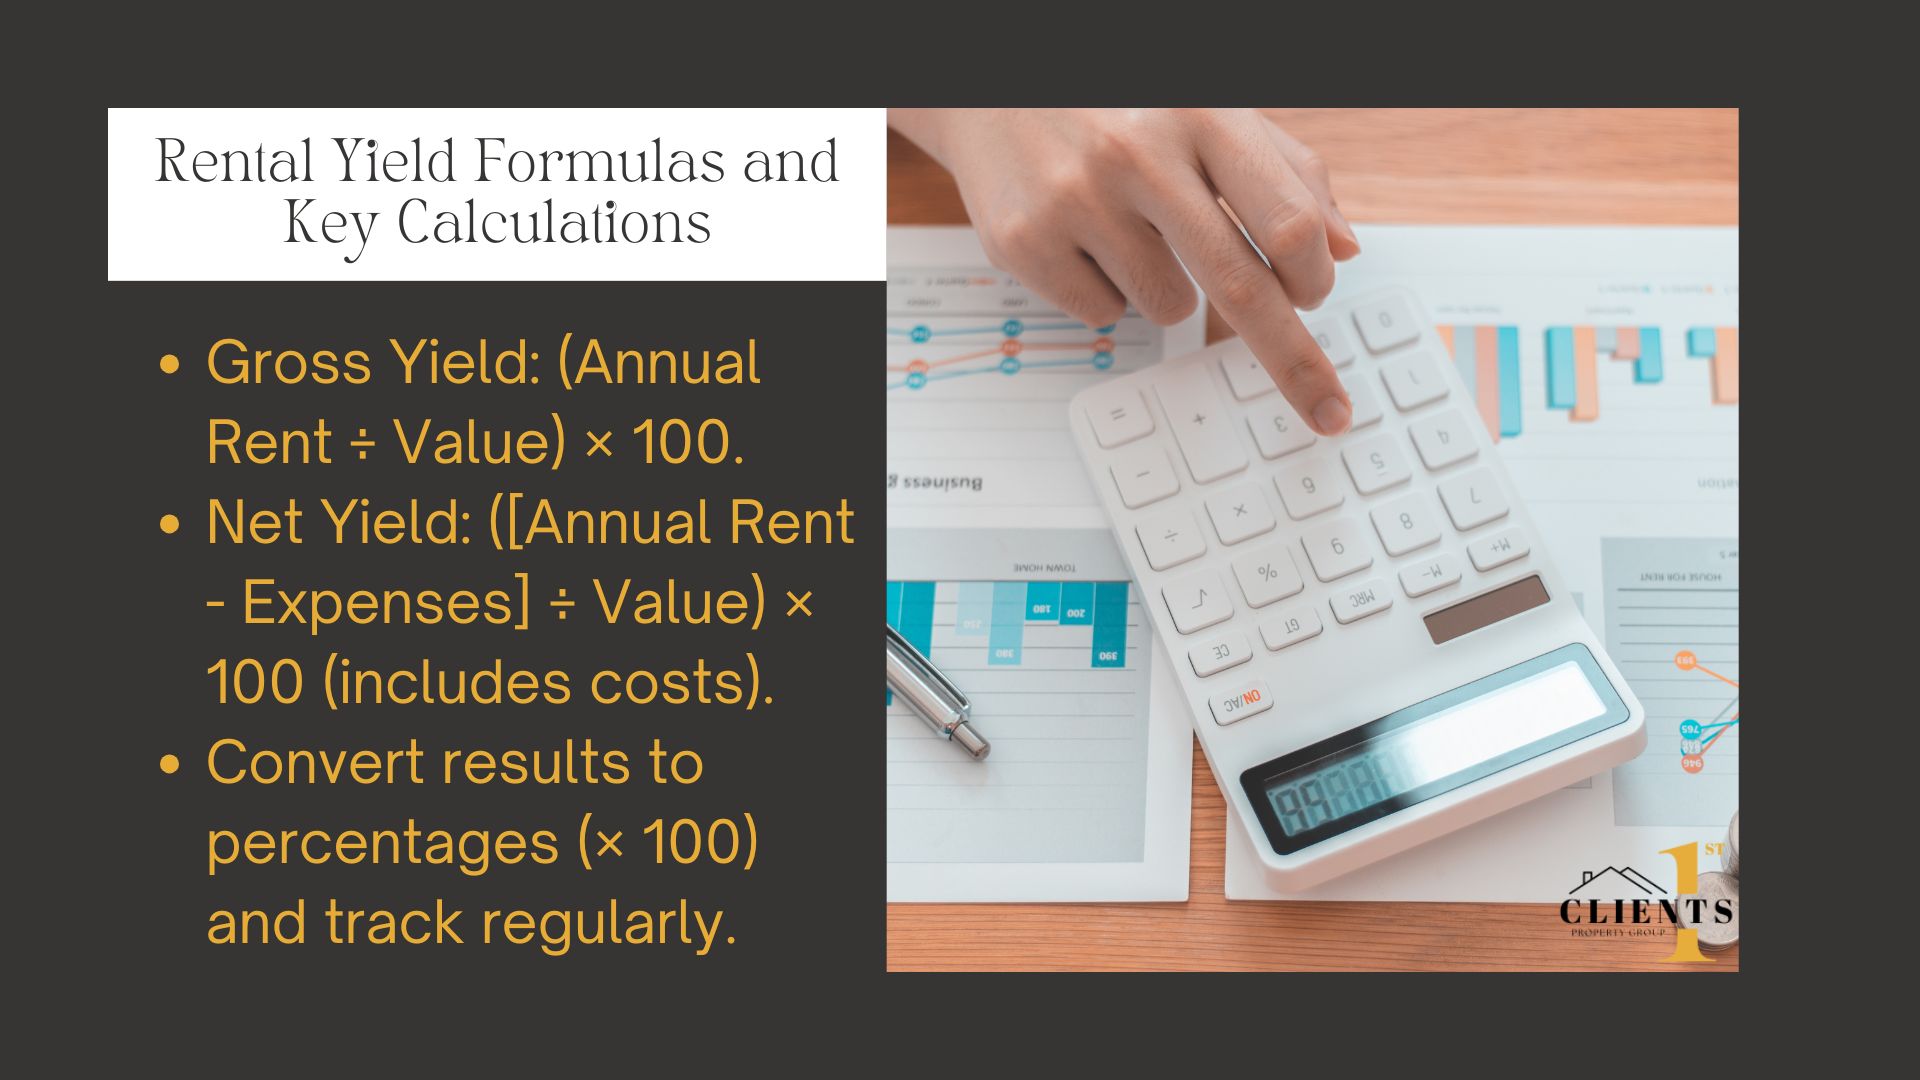
Rental Yield Formulas and Key Calculations
 Accurate financial analysis forms the backbone of successful property investments. Two core formulas transform raw data into actionable insights, helping investors gauge performance and forecast growth. Let’s break down these essential tools and their real-world applications.
The Rental Yield Formula Explained
Gross yield measures annual income relative to a property’s value. The formula is straightforward:
- Gross Yield = (Annual Rent ÷ Property Value) × 100
For a $200,000 home generating $15,000 yearly rent, this becomes ($15,000 ÷ $200,000) × 100 = 7.5%. Net yield factors in recurring costs:
- Net Yield = [(Annual Rent − Expenses) ÷ Property Value] × 100
If maintenance, taxes, and insurance total $4,000 annually, the net yield drops to ($11,000 ÷ $200,000) × 100 = 5.5%.
Converting Calculations into Percentages
Percentages standardize comparisons across properties. Consider a $180,000 condo with $14,400 annual rent and $3,200 in expenses:
- Gross: ($14,400 ÷ $180,000) = 0.08 → 8%
- Net: ($11,200 ÷ $180,000) = 0.062 → 6.2%
Market fluctuations directly impact these figures. Rising property values may lower yields if rents stagnate, while increasing local expenses squeeze net returns. As Clients 1st Property Group advises:
“Track both formulas quarterly—markets evolve, and your analysis should too.”
Mastering these conversions helps spot trends and adjust strategies. Whether evaluating a Charlotte townhome or suburban duplex, consistent math reveals opportunities hidden in spreadsheets.
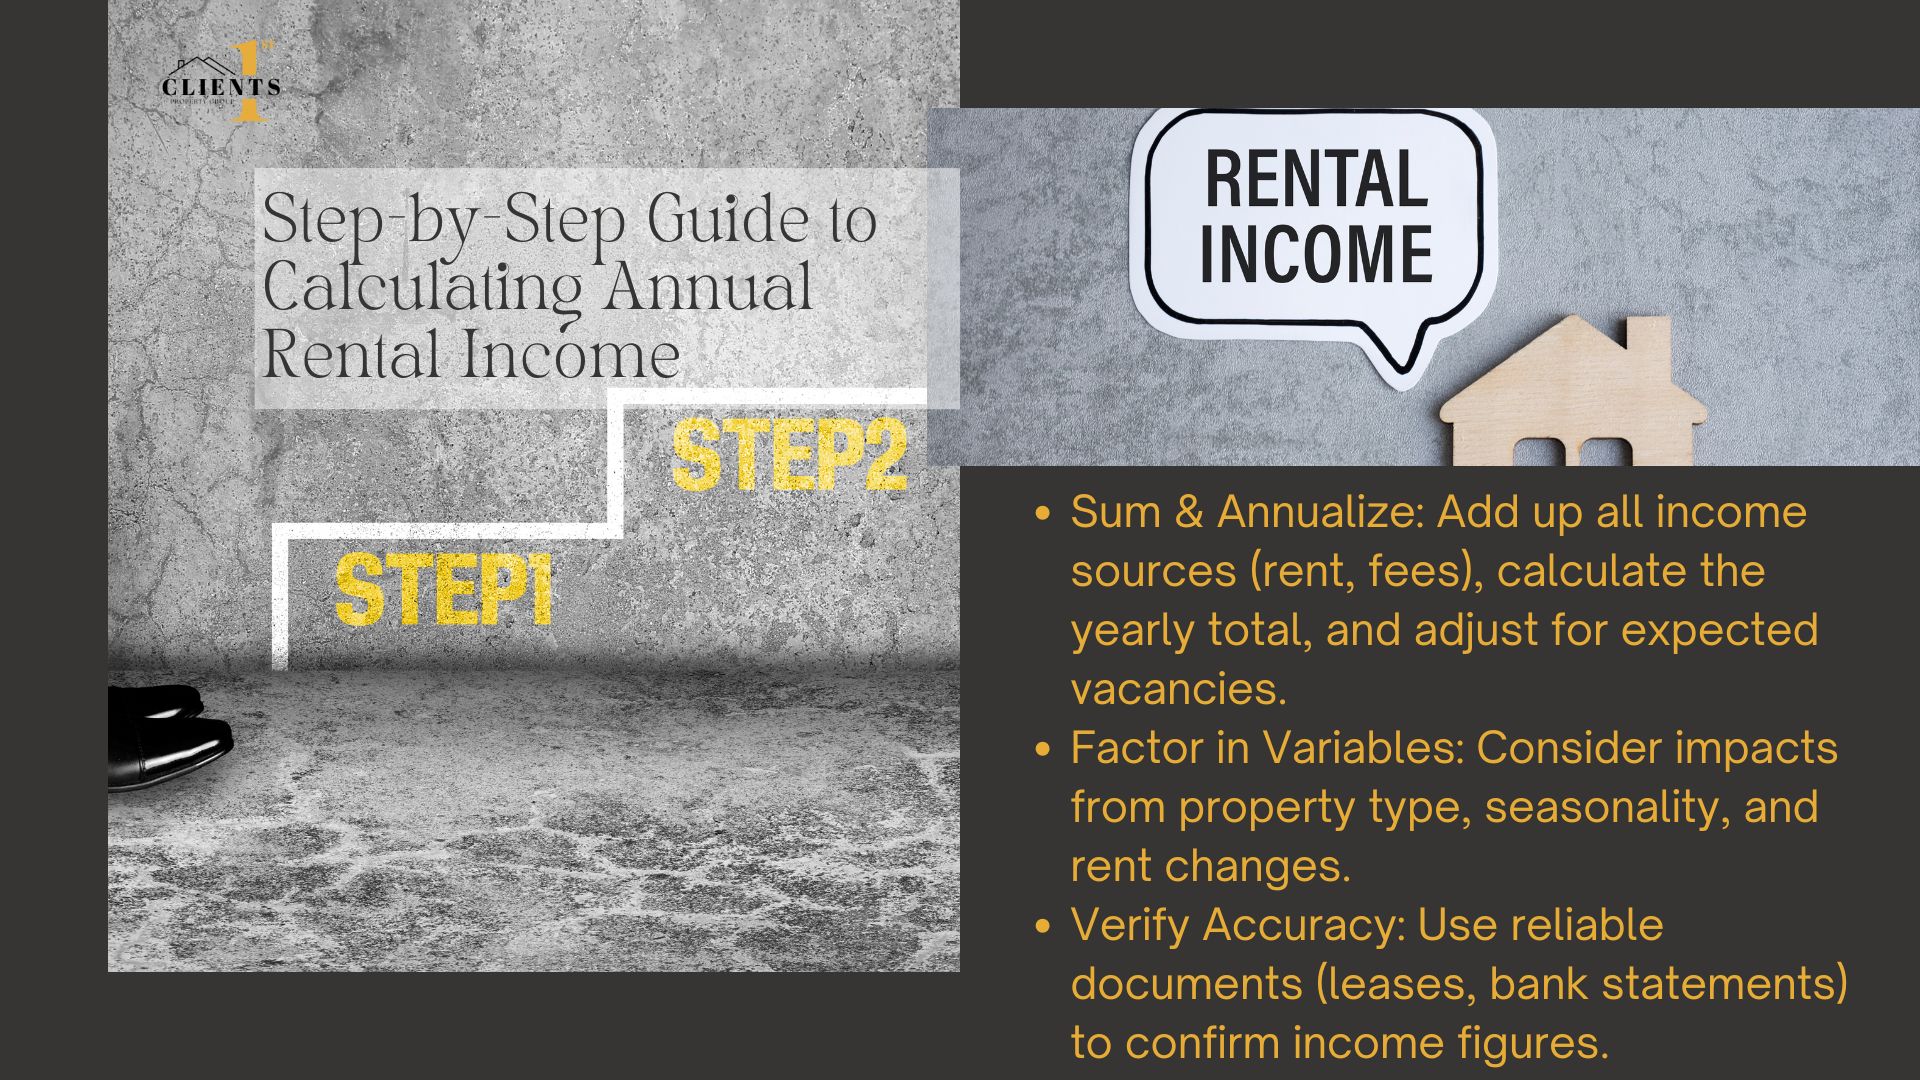
Step-by-Step Guide to Calculating Annual Rental Income
Building a reliable income picture begins with precise data gathering. Charlotte’s Clients 1st Property Group emphasizes this foundation: “Incomplete records lead to flawed projections—every dollar matters.” Their team assists investors in structuring data collection systems tailored to local market dynamics.
Collecting Rental Income Data
Start by documenting all revenue streams for your properties. A downtown Charlotte duplex might generate $2,200 monthly from tenants plus $150 from parking fees. Annualize these figures while accounting for vacancy periods—a 5% vacancy rate reduces 12-month totals by 18 days.
Key factors influencing percentages include:
- Property type: Single-family homes often have steadier occupancy than multi-unit buildings
- Seasonal demand: Vacation rentals near Lake Norman show 40% higher summer yields
- Additional income: Laundry facilities or storage fees boost returns
Verify data through lease agreements, bank statements, and property management reports. Clients 1st analysts recently uncovered a 12% discrepancy in self-reported income for a South End condo owner—a $3,600 annual oversight affecting yield calculations.
Essential checklist for accuracy:
- Track rent payment histories across all units
- Adjust for market-rate changes during lease renewals
- Document one-time fees like pet deposits
Accurate figures transform percentages from abstract numbers to actionable insights. A $275,000 Charlotte townhome generating $21,000 yearly shows a 7.6% gross yield—until $4,200 in expenses reveal a 6.1% net return. These distinctions guide smarter portfolio decisions.
Factors That Impact Rental Yield
Property returns depend on balancing income streams with ongoing obligations. Charlotte’s market dynamics reveal how fees and local trends shape net profits. Regular reviews of these elements help investors maintain competitive performance.
Assessing Operating Expenses and Maintenance
Hidden costs quietly reduce returns. Charlotte property management fees average 8-12% of monthly rent, while emergency repairs often cost $1,200-$5,000 annually. Consider this example:
- A $250,000 townhome generates $2,100 monthly rent
- 12% management fees: $3,024 yearly
- HVAC replacement: $4,500 (every 10 years → $450/year)
These fees cut the gross yield by 1.4% in this scenario. Clients 1st Property Group notes maintenance budgets often underestimate landscaping and pest control costs—common issues in North Carolina’s humid climate.
Market Trends and Property Value Influence
Charlotte’s 6% rent growth since 2022 contrasts with 3% national averages. Rising home prices create yield compression if income doesn’t keep pace. Key indicators to monitor:
- Local job market expansion (banking/tech sectors driving demand)
- New housing developments affecting vacancy rates
- Property tax reassessment cycles
A SouthPark condo purchased for $180,000 in 2020 now appraises at $240,000. Without rent adjustments, its gross yield dropped from 8.3% to 6.2% despite stable occupancy.
“Proactive expense tracking separates resilient investments from reactive ones. Charlotte’s market rewards those who anticipate rather than react.”
Investors can mitigate risks by negotiating service contracts and implementing preventative maintenance schedules. Quarterly expense audits paired with rent comparables analysis create opportunities to optimize returns.
Real-World Examples and Case Studies in Charlotte, North Carolina
Charlotte’s real estate market offers tangible lessons for investors seeking profitable opportunities. Local data reveals distinct patterns between residential and commercial assets, shaped by neighborhood growth and economic trends. Let’s examine how these property types perform in Mecklenburg County.
Residential vs. Commercial Property Examples
A 2023 study compared a NoDa townhome and an Uptown office building. The residential property, purchased for $325,000, generates $2,400 monthly rent. After $5,200 in annual maintenance and fees, its net yield reaches 7.1%. The commercial space, acquired for $1.2 million, delivers $9,500 monthly but requires $28,000 yearly in upkeep—resulting in a 6.8% net yield.
| Metric | Residential | Commercial |
|---|---|---|
| Average Purchase Price | $310,000 | $1.1M |
| Typical Rental Rates | $2,200/month | $8,900/month |
| Maintenance Costs | 8-12% of income | 15-20% of income |
Analyzing Local Market Data
Charlotte’s rental vacancy rate sits at 5.4%—below the national 6.8% average. South End apartments show 94% occupancy, while suburban office spaces face 18% vacancies. Investors should note:
- Residential rents grew 5.3% year-over-year
- Commercial lease rates stabilized after 2022 fluctuations
- Historic districts like Dilworth command 12% premium pricing
Maintenance challenges differ sharply. Single-family homes average $3,100 yearly upkeep, while mixed-use buildings require $15,000+ for compliance updates. As Clients 1st Property Group advises:
“Charlotte’s growth potential demands localized strategies. A Ballantyne condo and University City retail space require entirely different cost models.”
Strategies to Maximize Your Rental Yield
Enhancing property returns requires strategic adjustments across income and expenses. Savvy investors focus on two levers: boosting revenue streams and streamlining operational costs. Balancing these elements creates sustainable growth while maintaining asset value.
Optimizing Rental Income
Small upgrades often deliver significant returns. Installing energy-efficient appliances or adding storage space can justify 5-15% rent increases in competitive markets. Regular market comparisons ensure rates align with neighborhood trends.
| Strategy | Cost Range | Potential Yield Increase |
|---|---|---|
| Smart Home Features | $800-$2,500 | 3-7% |
| Landscaping Improvements | $1,200-$4,000 | 2-5% |
| Lease Renewal Incentives | $0-$500 | 4-9% |
Clients 1st Property Group notes:
“Properties with updated kitchens and laundry facilities achieve 11% faster lease-ups in Charlotte’s urban core.”
Controlling Costs and Maintenance Fees
Preventative care reduces emergency repair bills. Partnering with trusted contractors for HVAC inspections and roof maintenance cuts long-term expenses. Bulk purchasing of materials for multiple units often yields 12-18% discounts.
Key cost-control tactics include:
- Renegotiating property insurance annually
- Implementing water-saving fixtures to lower utility bills
- Using digital tools to track maintenance schedules
Analyzing property purchase price dynamics helps too. Investors might target slightly dated homes in emerging neighborhoods, where renovation investments can boost net rental income by 20-30% post-upgrade.
Maximizing Your Rental Yield: Key Takeaways and Strategies
Maximizing returns in real estate requires blending precise data with market insight. Gross and net figures provide distinct perspectives—one reflecting raw income potential, the other revealing true profitability after expenses. Consistent tracking of both metrics helps investors spot trends and adjust strategies effectively.
Accurate income and cost records directly influence capital growth, turning short-term gains into lasting value. Comparing market value trends against property purchase price benchmarks ensures fair deals while identifying undervalued opportunities. Strategic upgrades and expense controls, as discussed, further amplify returns over time.
Charlotte’s Clients 1st Property Group transforms these principles into tailored plans. Their team analyzes local dynamics—from neighborhood demand shifts to purchase price fluctuations—to help clients build resilient portfolios. For personalized guidance, reach them at (704) 622-4865.
Informed investors don’t just chase numbers—they cultivate sustainable wealth through clarity and expert partnerships. Start your next move with confidence.